As you can see, ChatGPT has highly regarded this asset as promising for investment. However, it has yet to overlook potential risks that should be considered.
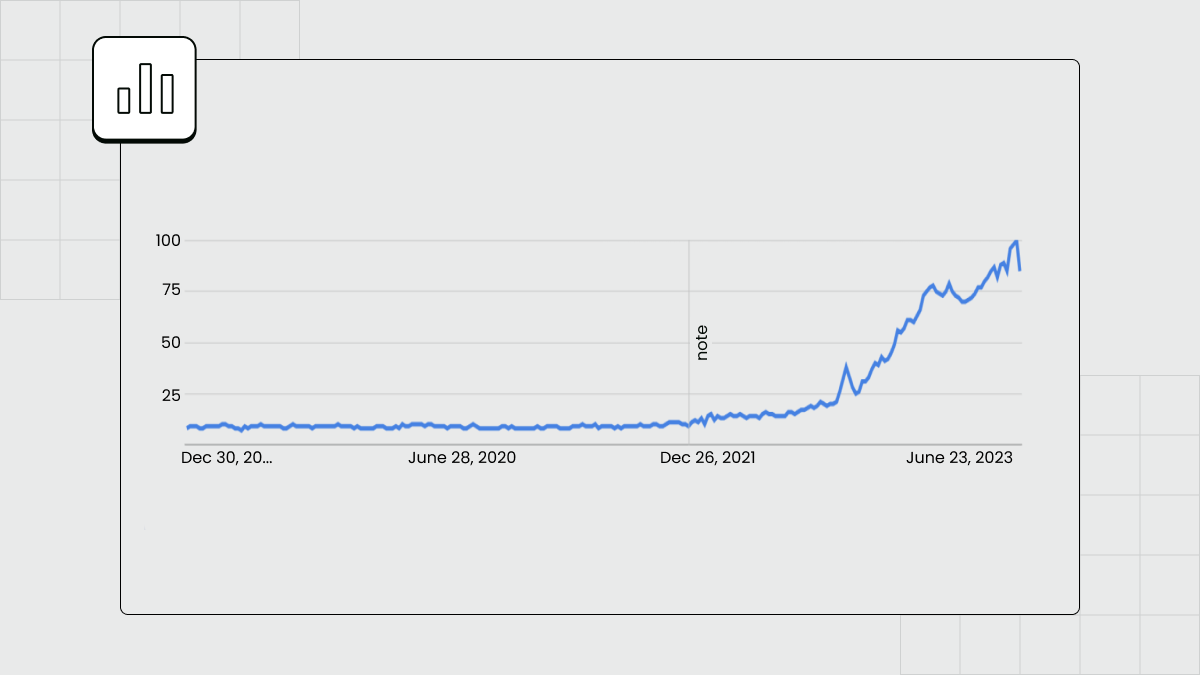
AI Market Outlook for 2024
Let’s take a more detailed financial overview of the tech giants: Microsoft, Oracle, TSMC, Snowflake Inc, IBM, and Baidu, using artificial intelligence in company reports, as per the instructions above:
1. Total Revenue: $56.52 billion, growth by 12.76%.
2. Gross Profit: $40.22 billion, growth by 15.99%.
3. Operating Profit: $26.89 billion, growth by 24.99%.
4. Net Profit: $22.29 billion, growth by 26.97%.
5. Earnings Per Share (EPS): Strong primary and diluted earnings growth.
6. EBITDA: $30.82 billion, growth of 26.77%.
7. Operating Expenses: $29.62 billion.
1. Total Revenue: $51.63 billion, growth by 8.17%.
2. Gross Profit: $33.84 billion, growth by 13.73%.
3. Operating Profit: $14.90 billion, growth by 22.11%.
4. Net Profit: $10.14 billion, growth by 43.77%.
5. Earnings Per Share (EPS): Positive EPS growth.
6. EBITDA: $21.07 billion, growth of 14.55%.
7. Operating Expenses: $36.73 billion.
1. Total Revenue: $38.17 billion, decrease by 0.44%.
2. Gross Profit: $20.92 billion, decrease by 10.55%.
3. Operating Profit: $17.05 billion, decrease by 12.86%.
4. Net Profit: $15.52 billion, decrease by 11.82%.
5. Earnings Per Share (EPS): $0.07, decrease by 12.50%.
6. EBITDA: $26.04 billion, decrease by 1.87%.
7. Operating Expenses: $21.12 billion, decrease by 5.49%.
1. Total Revenue: $734.17M, YoY growth +31.80%.
2. Gross Profit: $1.72B, YoY growth +38.89%.
3. Operating Profit: -$260.62M, YoY growth -26.50%.
4. Net Profit: -$214.25M, YoY growth -6.63%.
5. Earnings Per Share (EPS): Basic -$0.65, YoY growth -3.65%.
6. EBITDA: -$228.15M, YoY growth -29.64%.
7. Operating Expenses: $994.80M.
1. Total Revenue: $61.17 billion, growth by 4.57%.
2. Gross Profit: $32.98 billion, growth by 8.78%.
3. Operating Profit: $8.93 billion, growth by 48.35%.
4. Net Profit: $6.92 billion, year-over-year growth not specified.
5. Earnings Per Share (EPS): Positive earnings per share, specific growth not provided.
6. EBITDA: $13.31 billion, growth not specified.
7. Operating Expenses: $52.24 billion.
1. Total Revenue: $18.80 billion, growth by 0.11%.
2. Gross Profit: $9.66 billion, growth by 5.53%.
3. Operating Profit: $2.98 billion, year-over-year growth not specified.
4. Net Profit: $3.21 billion, year-over-year growth not specified.
5. Earnings Per Share (EPS): Positive earnings per share, specific growth not provided.
6. EBITDA: $4.02 billion, growth not specified.
7. Operating Expenses: $15.82 billion.
Common сonsiderations for all companies:
Market and Economic Conditions: All companies are influenced by broader economic conditions and market trends.
Technological сhanges: The rapid pace of technological advancements may affect the relevance of their products and services.
Regulatory risks: Operating in different regions exposes companies to regulation changes, affecting their operations and financial performance.
Competition: Each company faces competition in its industry, and market dynamics can influence its market share and profitability.
Summary